T&TTOOLS & TRADESMONEY · FIELD MANUALSFREE PUNCH LIST
COMPANION FIGURES · APPRENTICE · VOL. 1

Full-color figures & MATH boxes from the book

Every chapter’s MATH box and shop-manual figure, in full color — the same diagrams from the volume, sized for the phone in your hand.

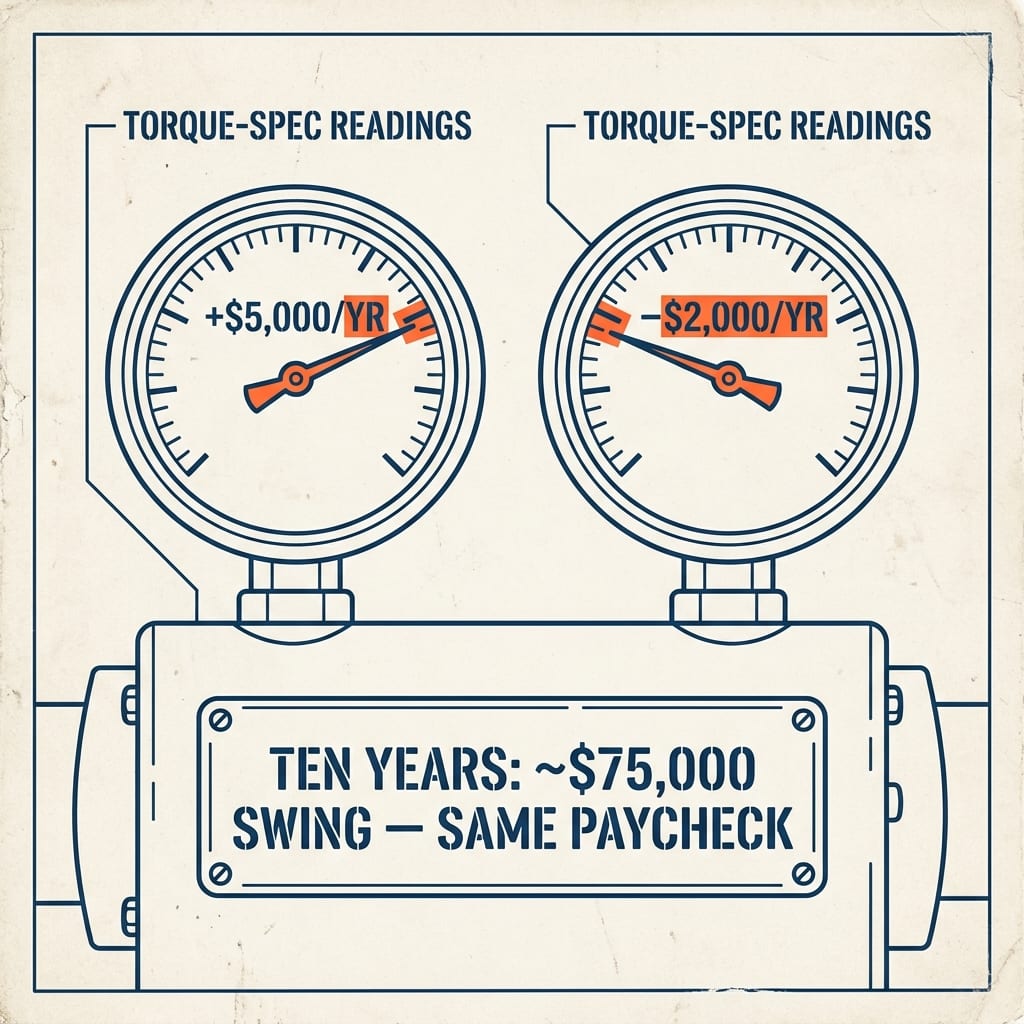
FIG 1.1The Only Rule That Builds WealthThe Only Rule That Builds Wealth
MATH BOXBalance-scale diagram: one pan earns $50K and spends $45K for +$5,000/yr, the other spends $52K for −$2,000/yr, a dimension line between them stamped ≈$75,000 swing over 10 years.
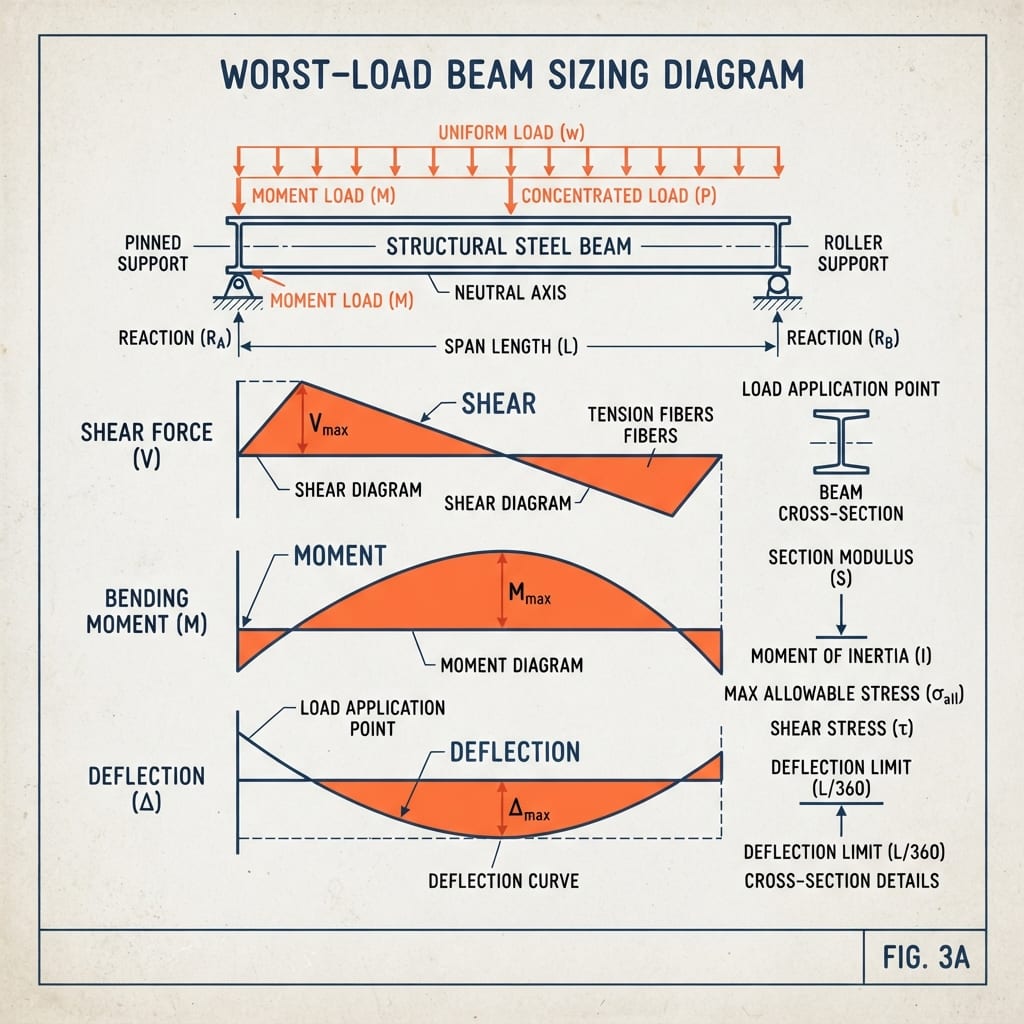
FIGUREBeam-loading diagram of a floor joist sized for the worst load, not the average load, the span stenciled “the floor budget.”
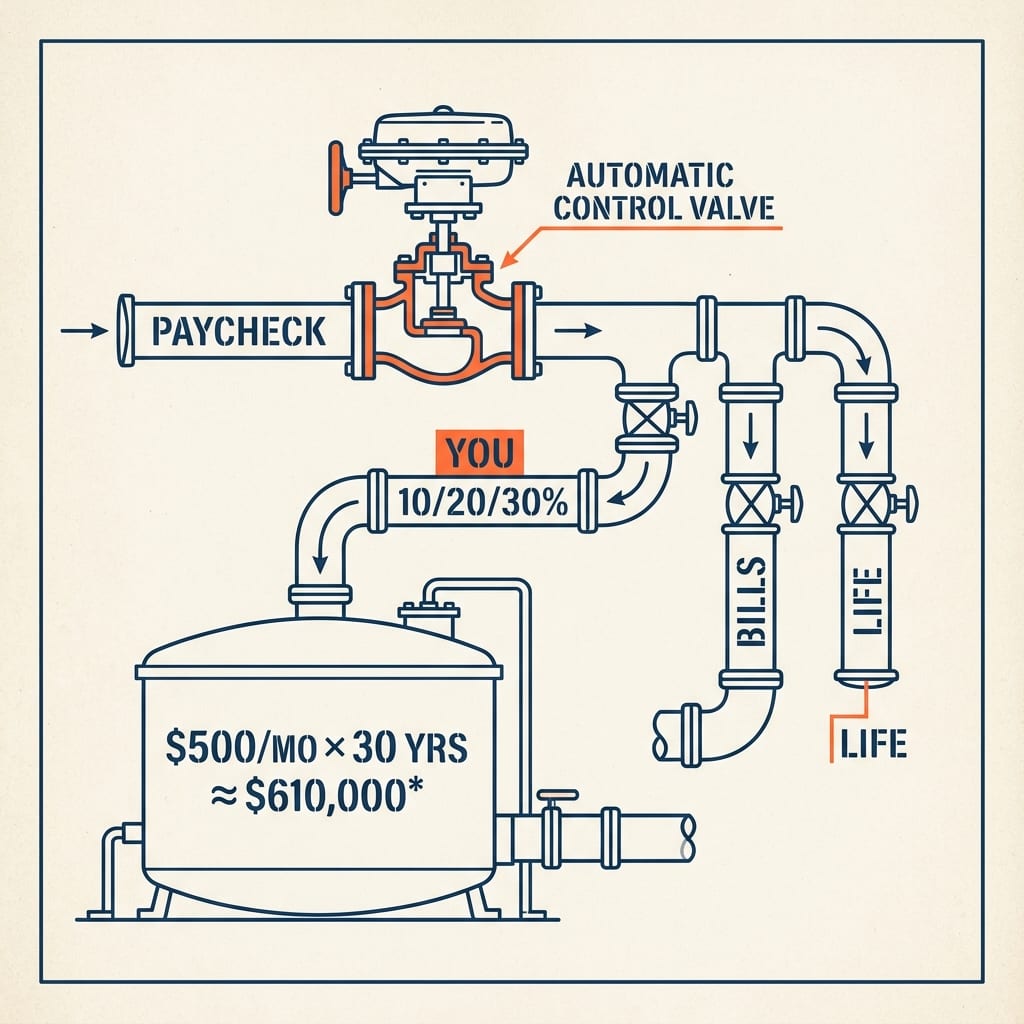
FIG 1.2the 10/20/30 savings ladderPay Yourself First — The 10/20/30 System
MATH BOXPipe-manifold diagram: a paycheck splits through an automatic valve; the first outlet (you, 10/20/30%) feeds a tank stamped $500/mo × 30 yrs ≈ $610,000, the rest flowing to bills and life.

Illustrative — assumes a 7% average annual return; real returns vary.

FIGUREA lockout-tagout hasp and orange tag on an electrical breaker labeled “savings — do not operate,” with a small plate reading “day after payday.”
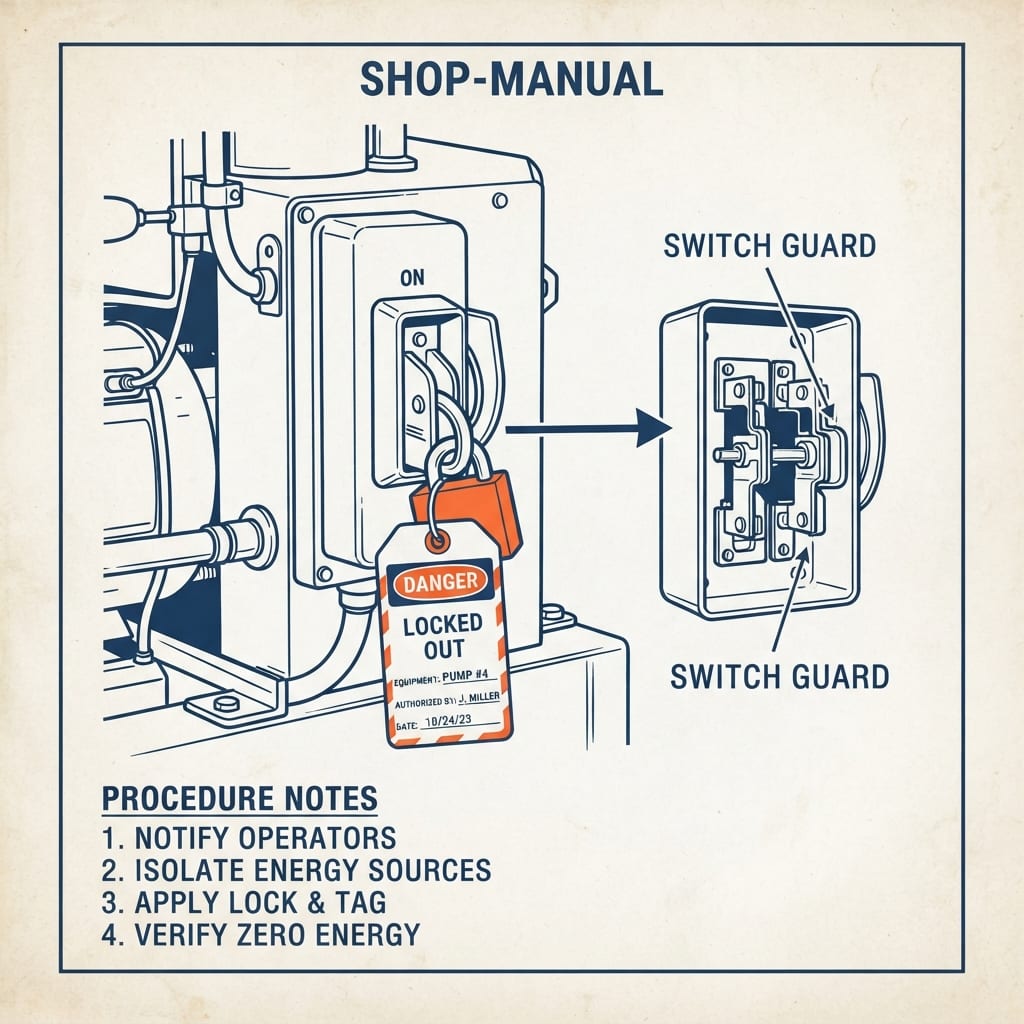
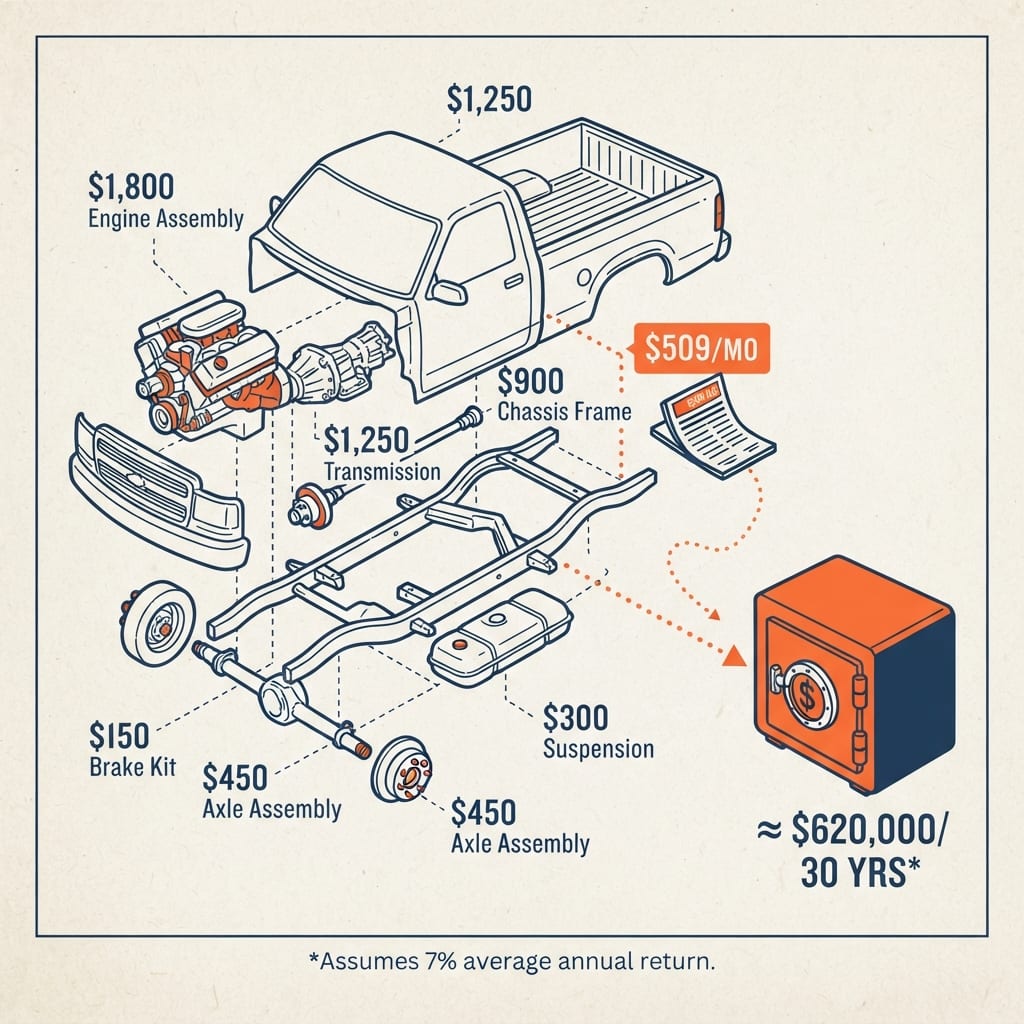
FIG 1.3the Tool Truck TestThe Big Three Leaks — Trucks, Tools, Toys
MATH BOXExploded-view schematic of a pickup truck with parts labeled in dollars; a $509/mo part drifts away and reassembles into a nest-egg vault labeled $620,000 over 30 years.

Illustrative — assumes a 7% average annual return; real returns vary.

FIGUREA wall cutaway with a slow pipe drip staining the subfloor, the three drips labeled trucks, tools, and toys.
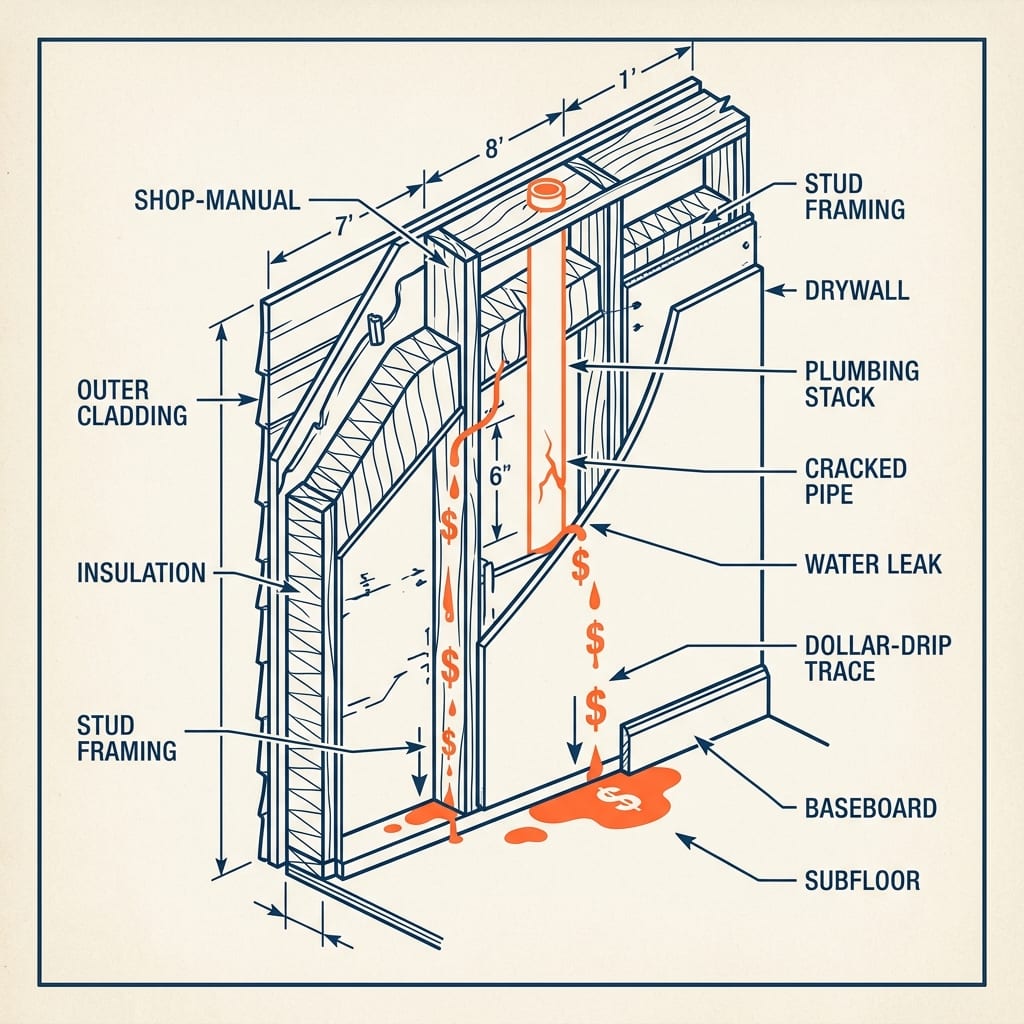
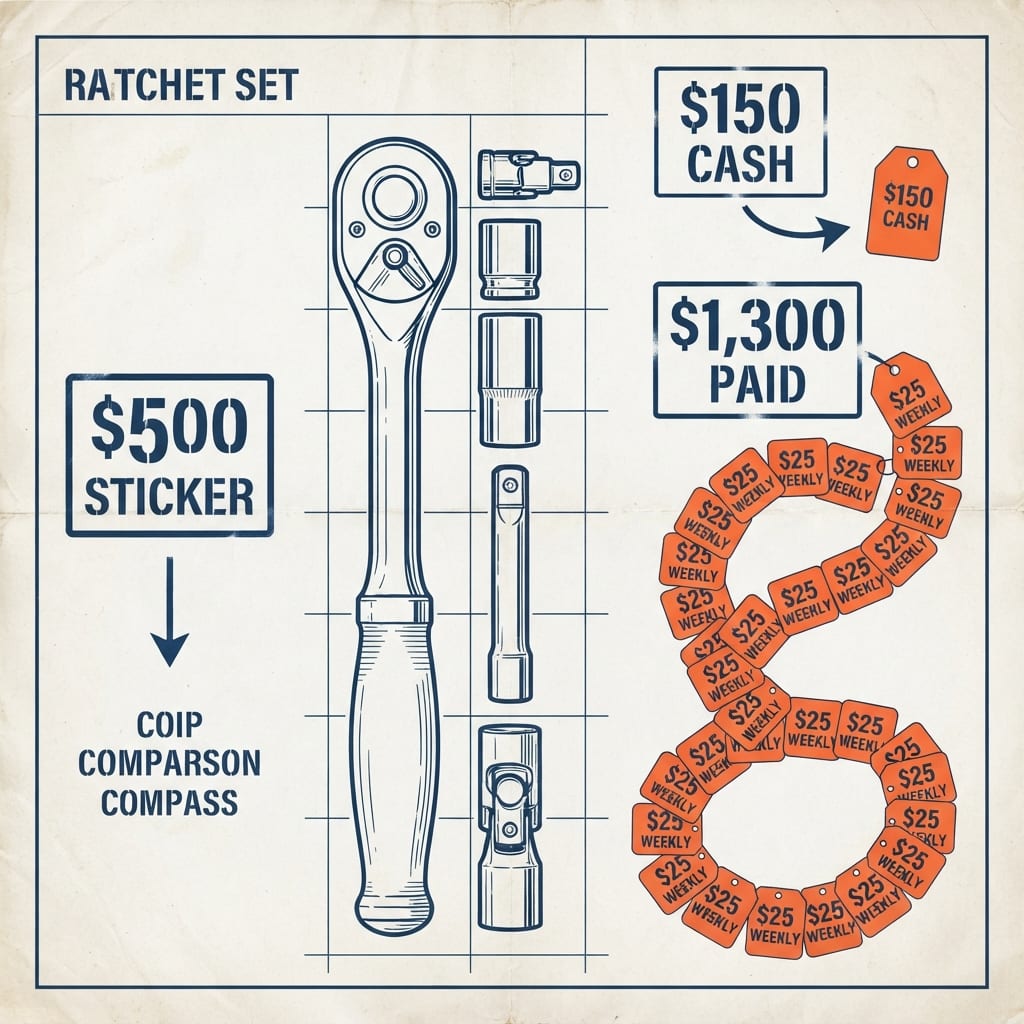
FIG 1.4The Tool Truck TrapThe Tool Truck Trap
MATH BOXA ratchet set on a spec sheet: a $500 sticker beside a chain of 52 payment tags totaling $1,300 paid, versus a plain $150 cash tag.
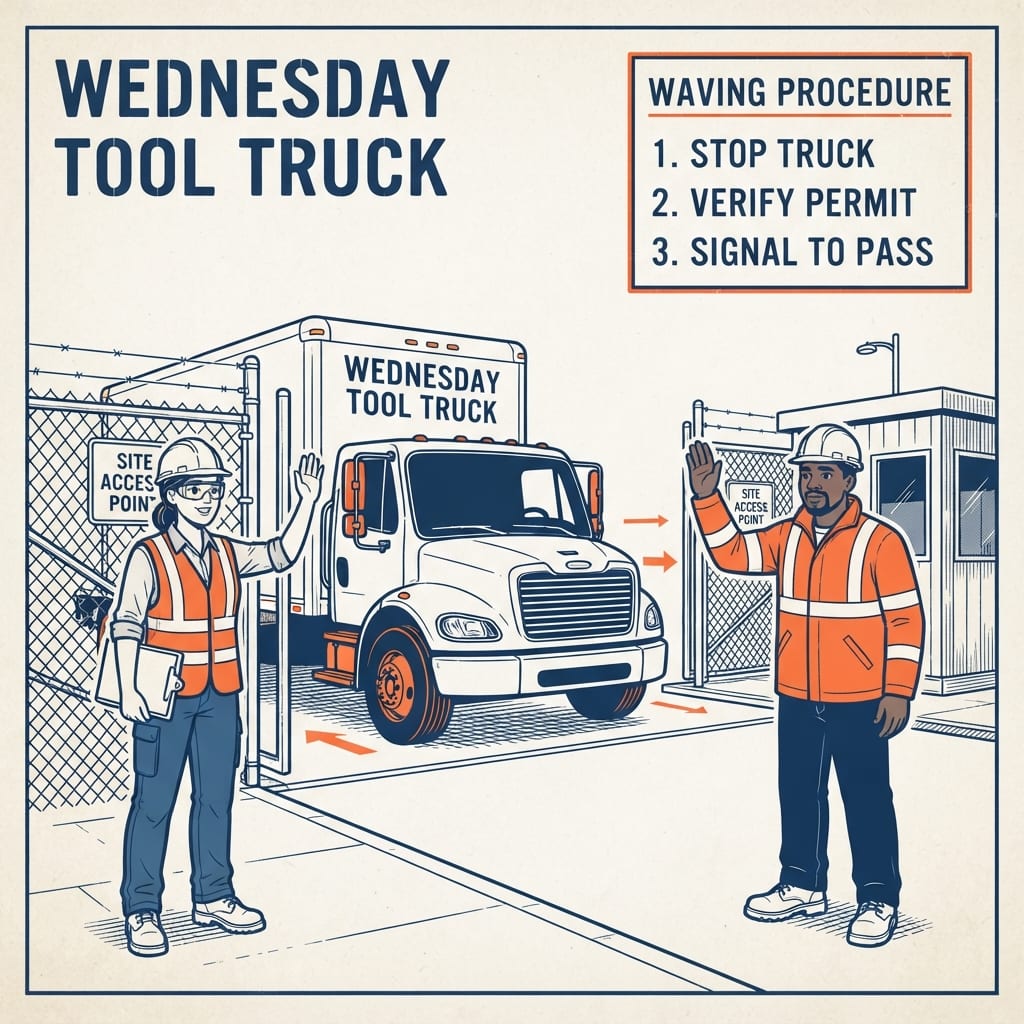
FIGUREA tool truck at a jobsite gate drawn as a rolling bank vault on a step-van body, weekly payment receipts fluttering like tags.
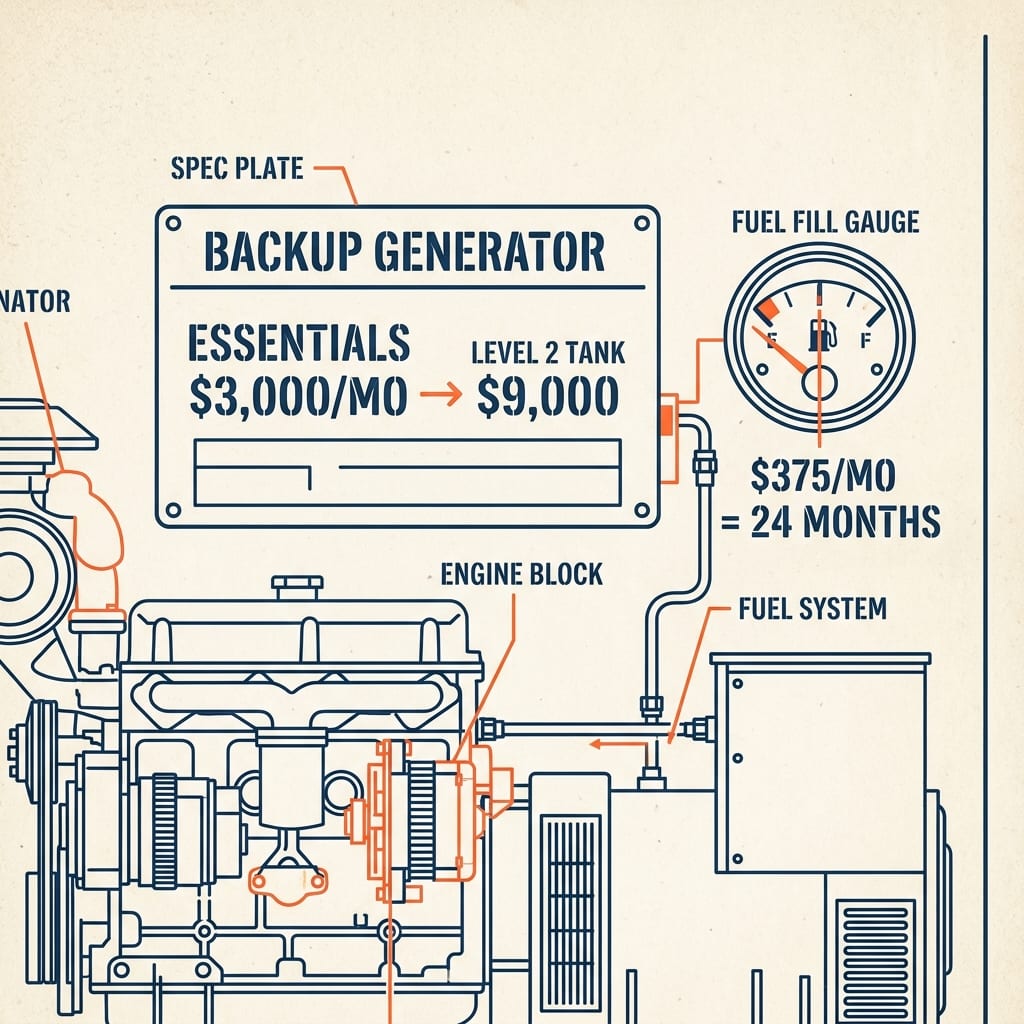
FIG 1.5the Worst-Month BudgetThe Backup Generator — Your Emergency Fund
MATH BOXA backup-generator cutaway with a fuel gauge marked in months; zones read $1,000 first, 3 months = $9,000, and 6–12 months, fed by a pump stamped $375/mo.
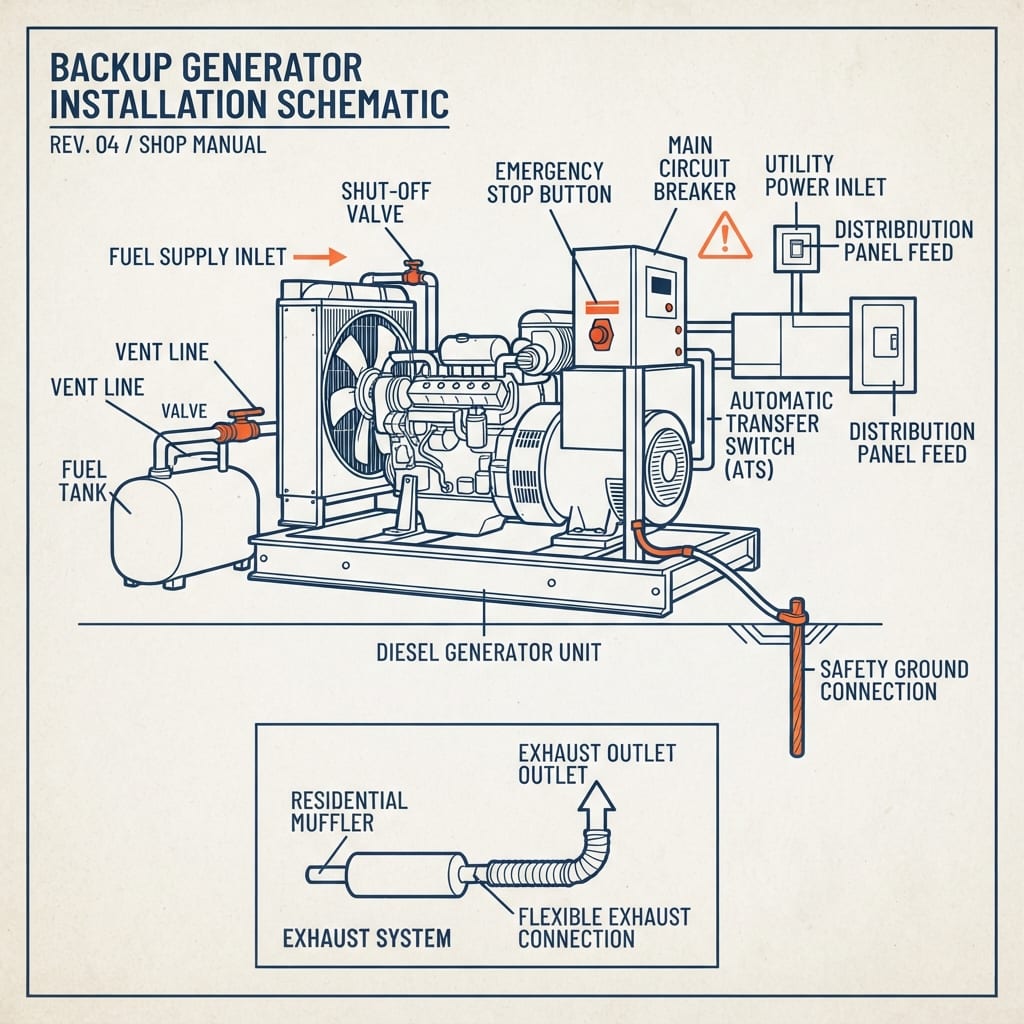
FIGUREA standby generator beside a small house, its transfer switch labeled “grid-down only: job loss, medical, major repair.”
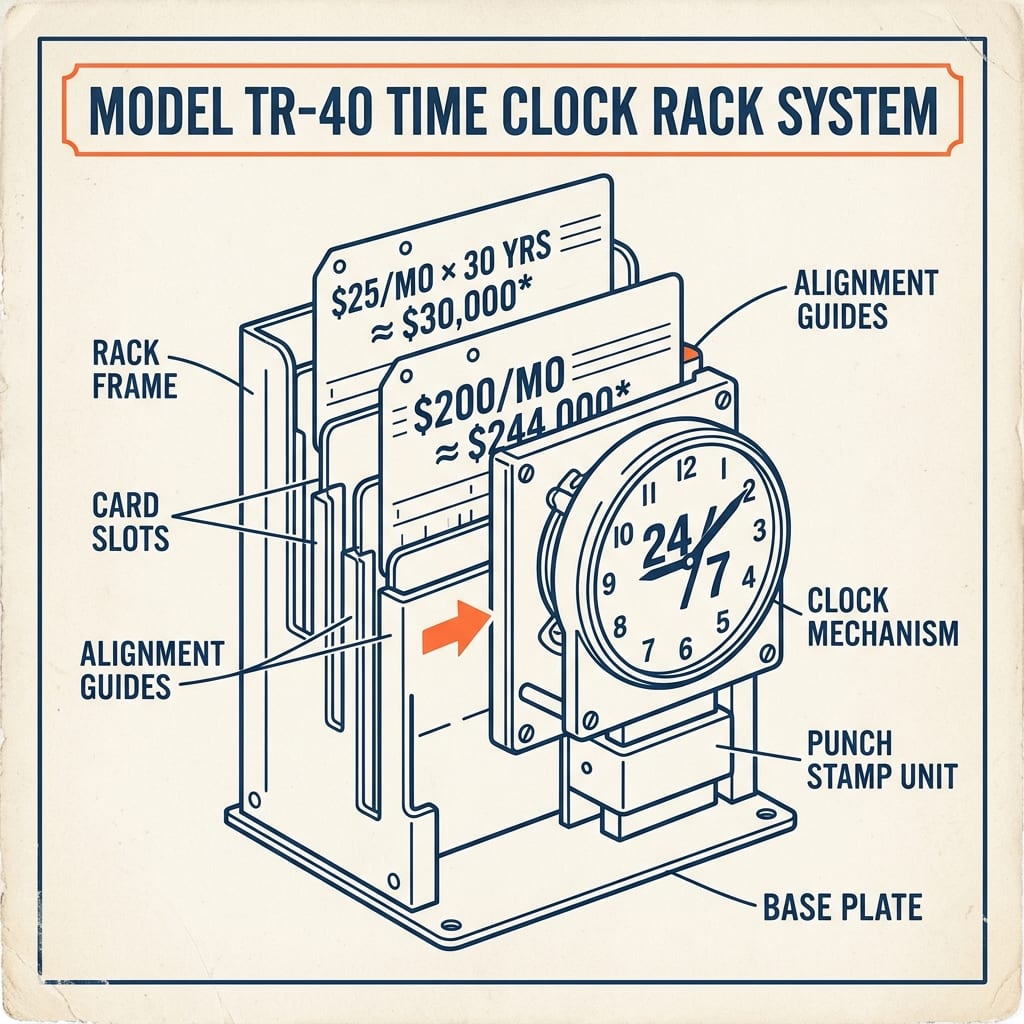
FIG 1.6Put Your Money on the ClockPut Your Money on the Clock
MATH BOXA time-clock punch-card rack: one card stamped $25/mo × 30 yrs ≈ $30,000, a thicker card $200/mo ≈ $244,000, a note reading “you put in $9K / $72K.”

Illustrative — assumes a 7% average annual return; real returns vary.

FIGUREA crew of small worker figures made of coins carrying I-beams up a growth curve, one foreman figure stenciled “you.”
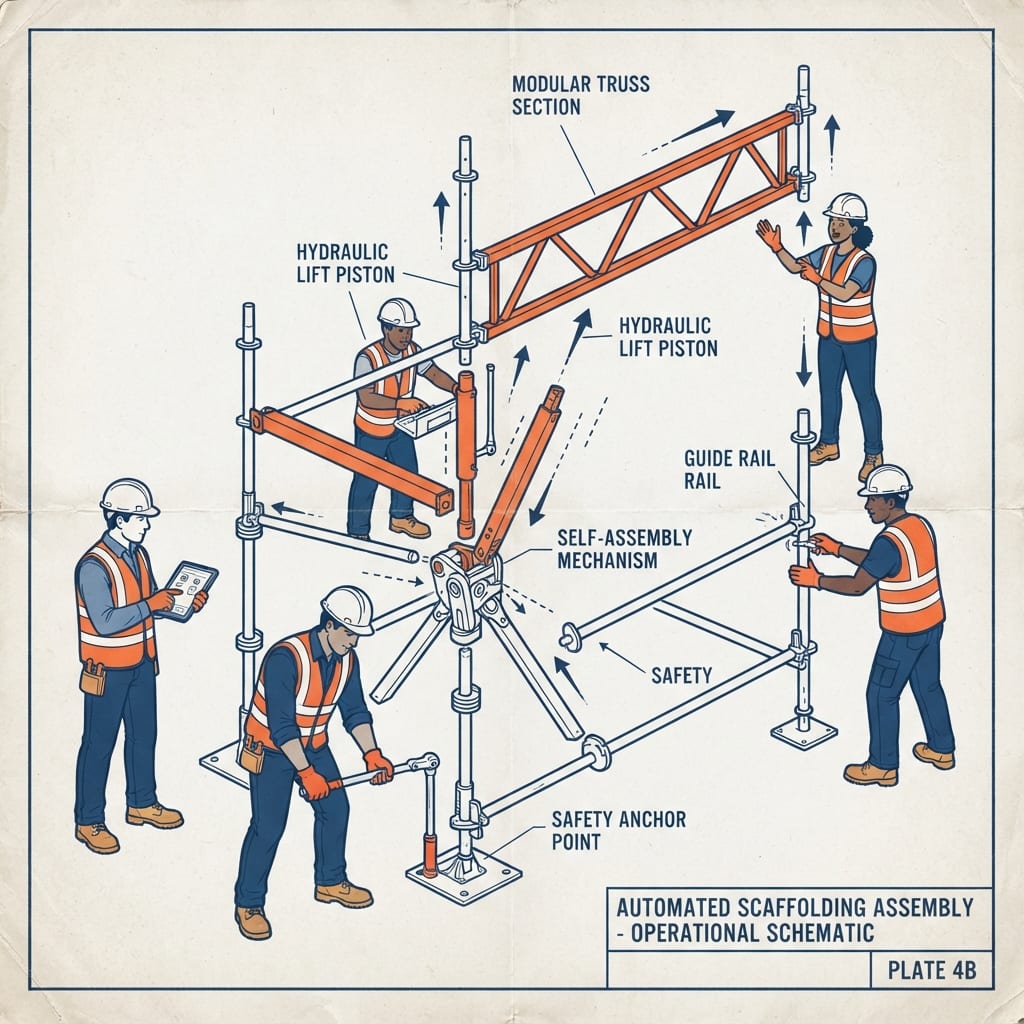
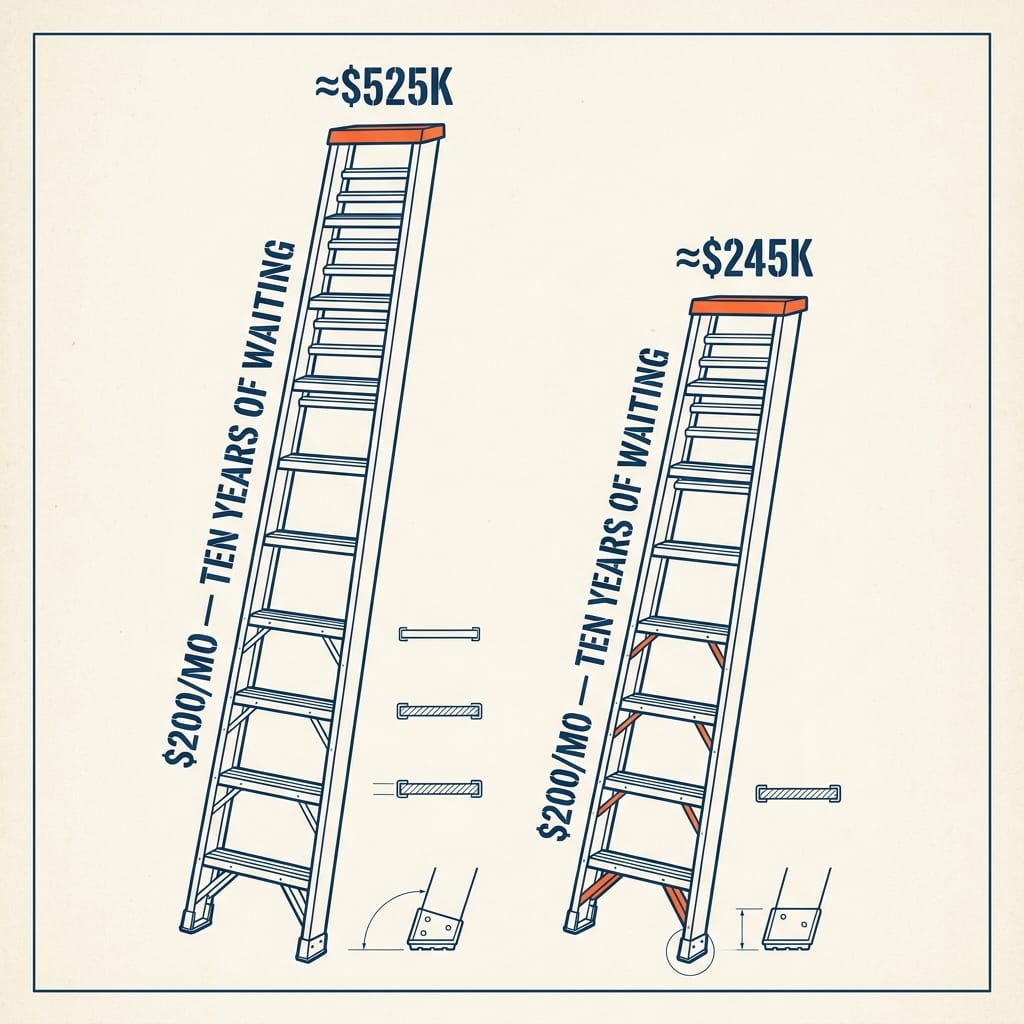
FIG 1.7Apprentice Rules — Your First Five YearsApprentice Rules — Your First Five Years
MATH BOXA wage-scale ladder: $200/mo starting at 22 rises to about $525K by 62 in blue; a shorter ghosted ladder starting at 32 reaches about $245K, the gap dimensioned “the cost of waiting.”

Illustrative — assumes a 7% average annual return; real returns vary.

FIGUREAn apprentice wage-progression chart drawn as a jobsite ladder with raise tags, half of each tag peeling off toward a savings tank.
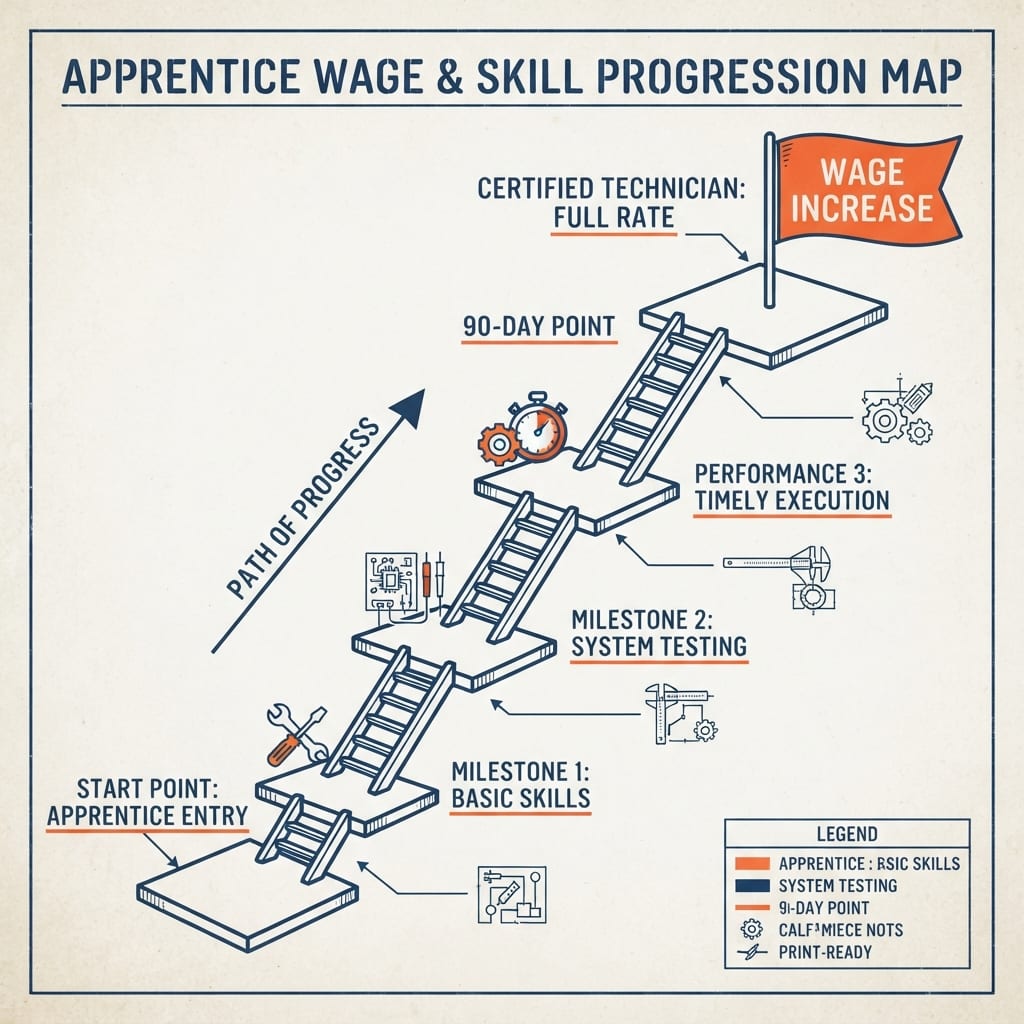
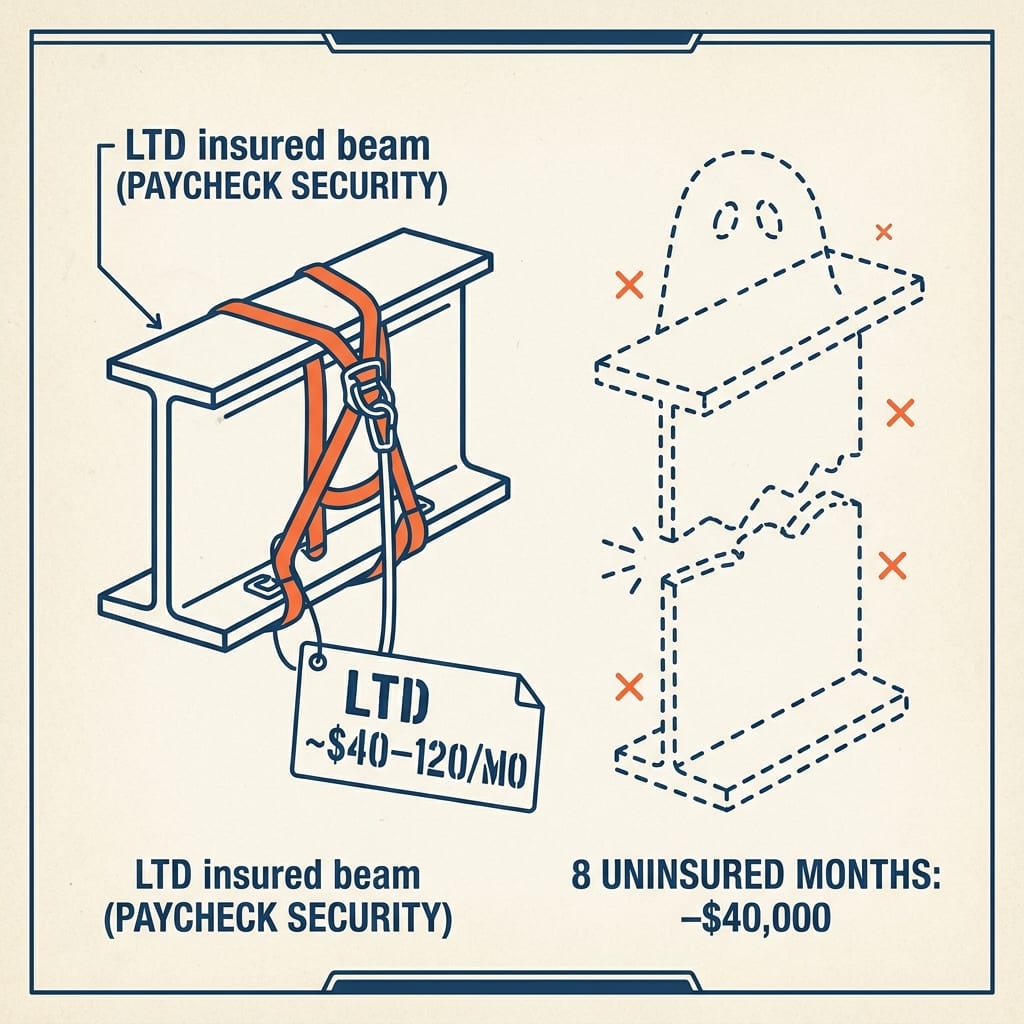
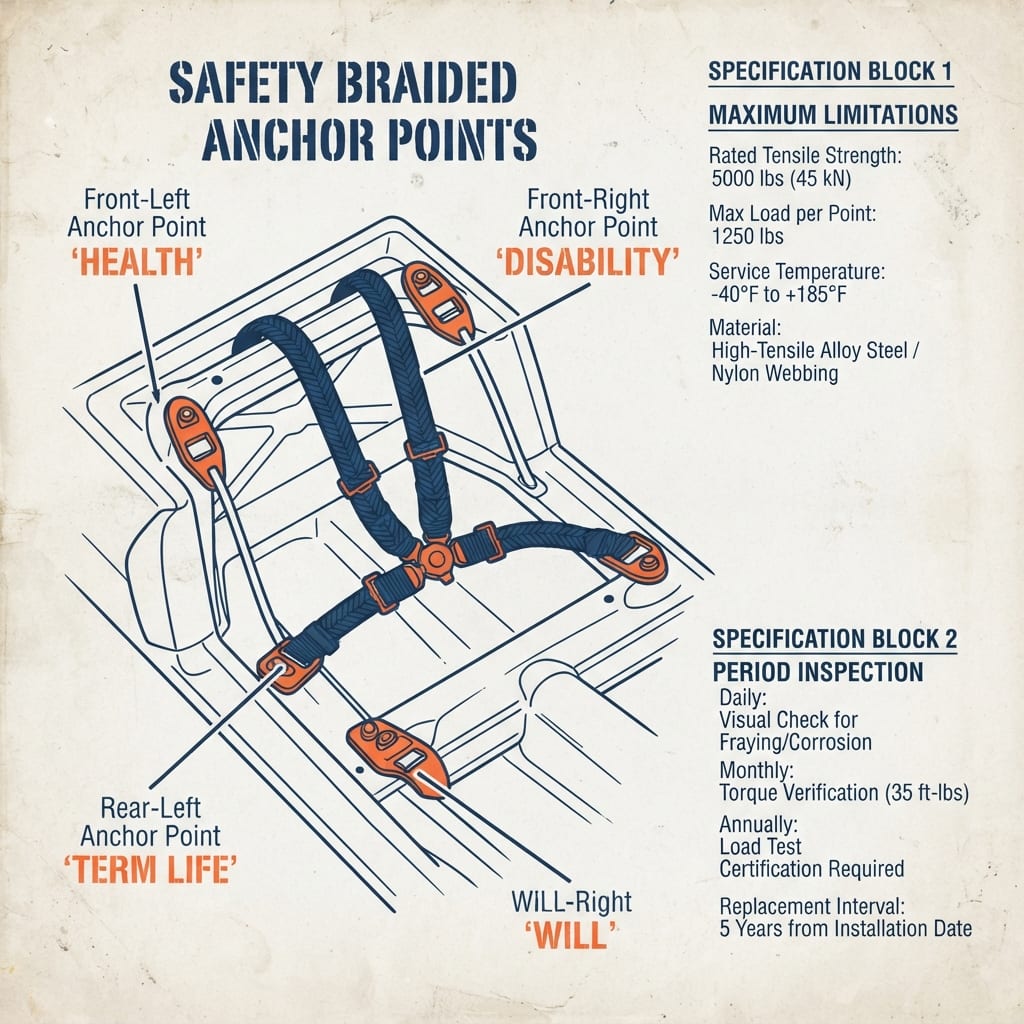
FIG 1.8Protect the BuildProtect the Build
MATH BOXA torque-spec plate: one bolt labeled disability coverage ~$40–120/mo, a second cracked bolt labeled “8 uninsured months = −$40,000.”
FIGUREA four-point harness anchor diagram with the points labeled health, disability, term life, and will.
← BACK TO THE BOOKS